Table of Contents
The cluster pages show different aspects of cluster-related
information for a dedicated cluster system. The pages may be
selected using the links within the Node
Details navigation area.
The cluster overview page shows the overall state of a particular cluster. A brief information summary is displayed:
A summary of the current load of all nodes using a loadbar. See loadbar for details.
Details of the current node states. Shown as colored icons.
An overall load history diagram providing average and maximum load of all nodes.
A current node load diagram giving the actual load value of each cluster node. This diagram uses bar charts for small clusters and radar charts for larger systems.
An event list for the specified period of time.
A job list providing information about how many and which ParaStation jobs are currently executing.
The picture shown in Figure 8.1 is an example for a typical cluster overview page.
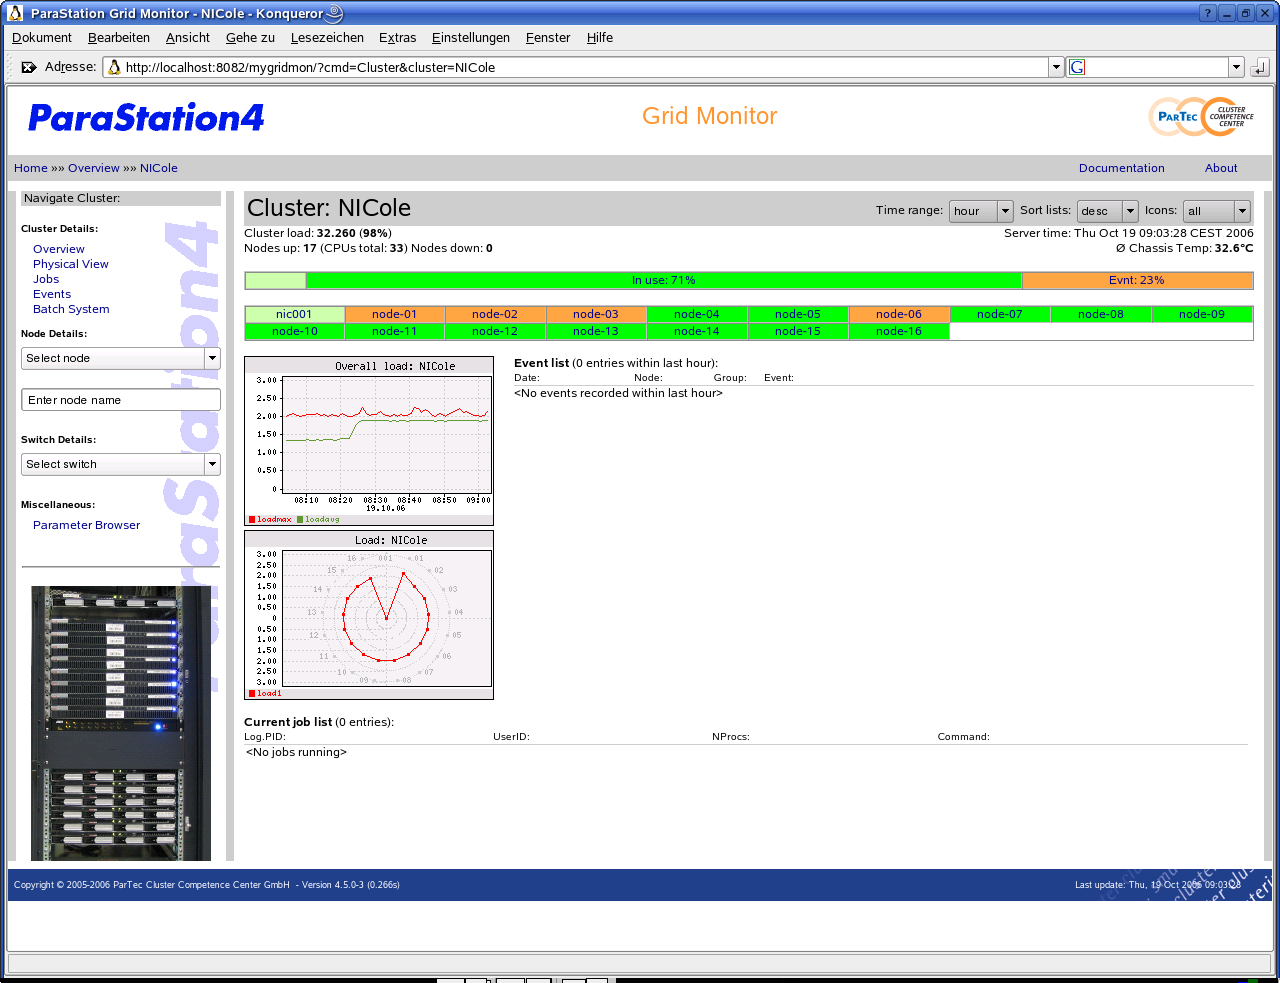
Note
The example shows a cluster with four nodes marked as having pending events. However, the event list is empty. This is ok, as the events still pending on the nodes happened not within the timeframe selected for the event list.