- Agent
An agent is a process startet or at least contacted by the collector. It returns information upon requests made by the collector. An agent may run on the collector node and retrieve data using network connections or may run on a remote node to retrieve data local to this node.
Currently, agents for general node parameters (
psvalue), Torque (psvalue_pbs), the ParaStation daemon (pscollect_psi), Torque and ParaStation accounting (psvalue_acc) and BMCs using IPMI (psvalue_ipmi) are available. The SNMP agent is built-in to collector- BMC
A baseboard management controller (BMC) is a small controller within a server enabling system independent information retrieval and node management. BMCs typically provide a LAN interface using the IPMI protocol to allow for example reseting of the node, reading sensors parameters, FRU parameters, etc.
BMC are often refered to as IPMI controllers.
- Collector
A process collecting and managing all the information within one (or more) clusters. It is running on the collector node, which is typically the cluster master node. Only one instance of the collector is required within a cluster. The collector gathers information using agents.
Within this document, the software package holding all necessary files to run the collector process is sometimes called collector, too.
- Collector node
This is the system where the collector is running. For smaller cluster systems, this is often the frontend node, for large clusters a dedicated master node should be used.
The collector node must not necessarily be part of the cluster, in many installations its a dedicated server running the collector and the webserver providing the GridMonitor GUI.
- Cluster node
An independant hardware entity within a cluster. Cluster nodes may be dedicated compute nodes, frontend nodes, master nodes, fileservers, I/O-nodes or other management nodes like collector nodes.
- Frontend node
A dedicated cluster node, intended for user login, compiling applications, launching jobs, etc. Within smaller clusters, this node is often used as a management node, too.
- Compute node
Dedicated servers within the cluster running the compute jobs.
- Management node
A system (or cluster node) within a cluster not or not only used for computing purposes, but for management tasks. This node typically runs services required clusterwide like NIS, NFS server, batch queuing system, GridMonitor, etc.
Within larger clusters, dedicated management nodes are available, like batch queuing system servers or file servers.
The management node is often refered as master node.
- GridMonitor
A software bundle to monitor various kinds of activities within a cluster. The GridMonitor consists of a collector, agents and a GridMonitor GUI.
- GridMonitor GUI
Graphical user interface for the GridMonitor. The GridMonitor GUI is based on web pages, generated by an Apache webeserver using PHP scripts. For more details, refer to Chapter 6.
- IPMI
The Intelligent Platform Management Interface (IPMI) defines a set of common interfaces to computer hardware and firmware which system administrators can use to monitor system health and manage the system.
- Loadbar
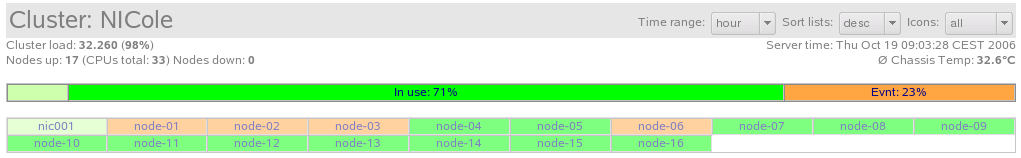
The loadbar is a small bar showing the status of the cluster. Each section of the bar shows the percentage of the nodes in status idle (light green), in use (green), event pending (orange) and unavailable (red).
The loadbar shown in Figure 15 shows a cluster having a small fraction of idle nodes, 71% of the nodes being in use and 23% of the nodes having a pending event. No dead nodes (red) are shown. Be aware that nodes with pending events may also run jobs.
Clicking on the loadbar will reload the current page providing an icon list showing all nodes with the selected status, e.g. all dead nodes. Refer also to Chapter 8.
- Parameter type system
Beside the actual data, the collector also provides information about the type of available data. This is called the
parameter type system. Using this system, it's easy for a GridMonitor GUI to construct dynamic selection boxes without actually reading the data and therefore wasting network bandwidth and compute cycles. The parameter type system also enables a GridMonitor GUI to dynamically include new parameters without modifying the scripts or page layout.The
parameter type systemis for internal use only and does not show up to the user or administrator.- SNMP
Simple Network Management Protocol, implemented for many types of network devices.- Administration Network
The administration network is used for exchanging (meta) data used for administrative tasks between cluster nodes.
This network typically carries only a moderate data rate and can be entirely separated from the data network. Almost always, Fast Ethernet or Gigabit Ethernet is used for this purpose.
- Data Network
The data network is used for exchanging data between the compute processes on the cluster nodes. Typically, high bandwidth and low latency is required for this kind of network.
Interconnect types used for this network are Myrinet or InfiniBand, and (Gigabit) Ethernet for moderate bandwidth and latency requirements.
Especially for Ethernet-based clusters, administration and data network are often combined into a single interconnect.
- Node states
Each node has an associated state, which describes the node from an administrator's point of view. Within the GridMonitor GUI, four different states are currently defined:
Table 2. Node states
State Description idle The node is currently available and not used. in use The node is currently available and used. event pending The node is currently available and may be in use, but there is at least one event pending. dead The node is currently not available. - Icon area
Within the cluster overview page, the icon area shows icons for all or a selected set of the cluster nodes. These icons are colored, indicating the current state of the respective node. See Node states for details about node states.
The nodes shown in the icon area can be defined by using the
iconpull-down menu. See the section called “View configuration” for details.