Each diagram within the GridMonitor GUI can be clicked on to bring up a
detailed diagram page.
Within the left hand navigation area of this diagram page, the
size of the chart can be selected (small,
medium, large).
The default diagram size within this page is configurable, see
the section called “Configuring GridMonitor GUI default values” for details.
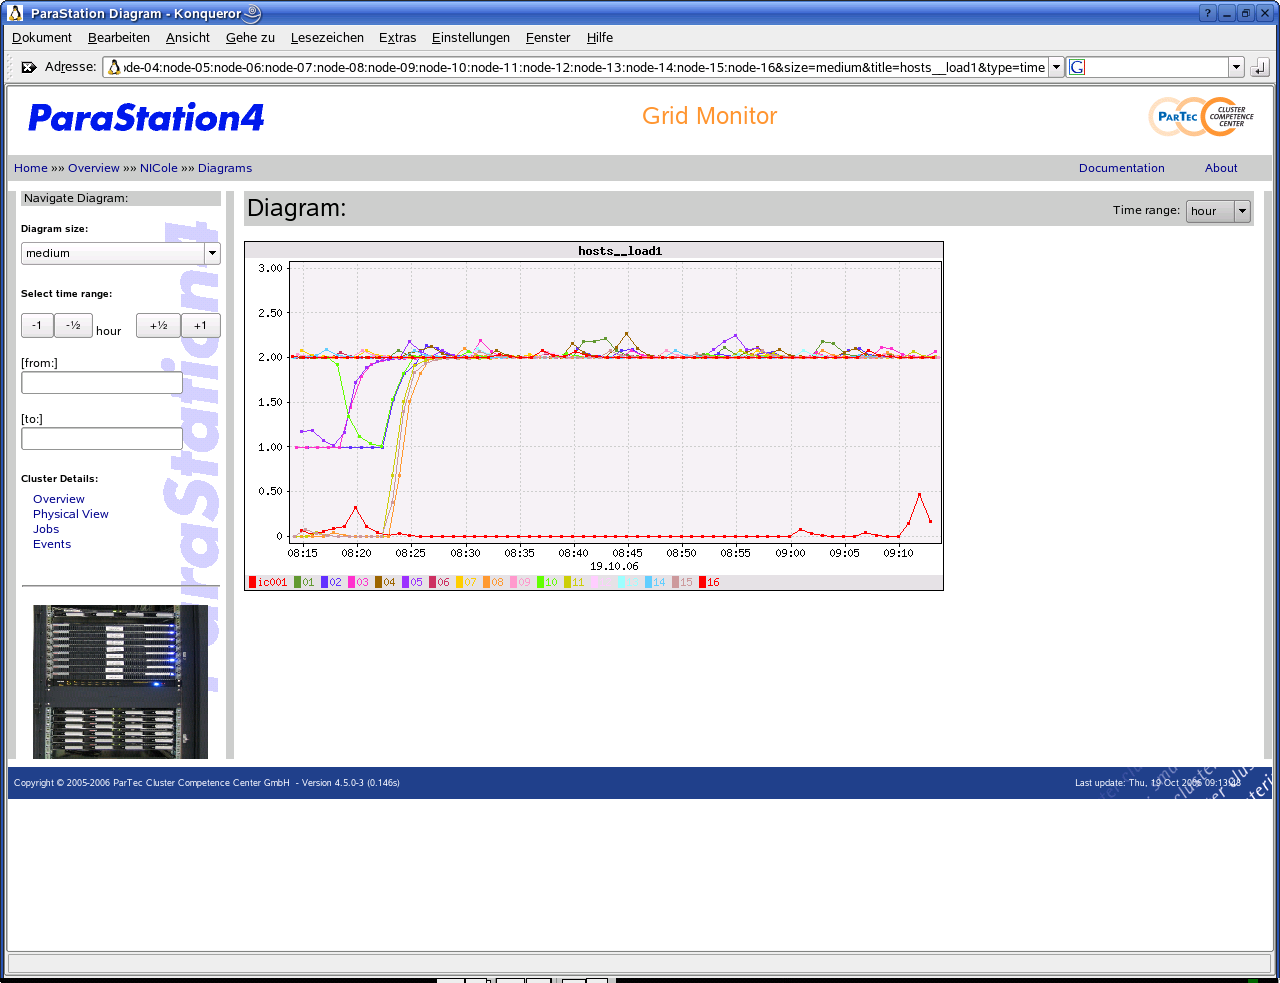
For history charts, the displayed time frame can be redefined, by selecting the appropriate entry from the pull-down menu. Alternatively, a dedicated time frame can be selected using the left hand navigation area entries and . Time entries are in the format dd.mm.yyyy hh:mm:ss. In addition, the current time frame can be moved back and forth, if already in the past, on the time axis using the , , and buttons within the 'Select time range' area of the left hand navigation area.